

Follow your system
Five pages show what your system is doing, what it costs, and what it has saved. Here is what each part means, and how you use it.
Overview
The first thing you see when you log in. Where the power is coming from, and where it's going, right now.
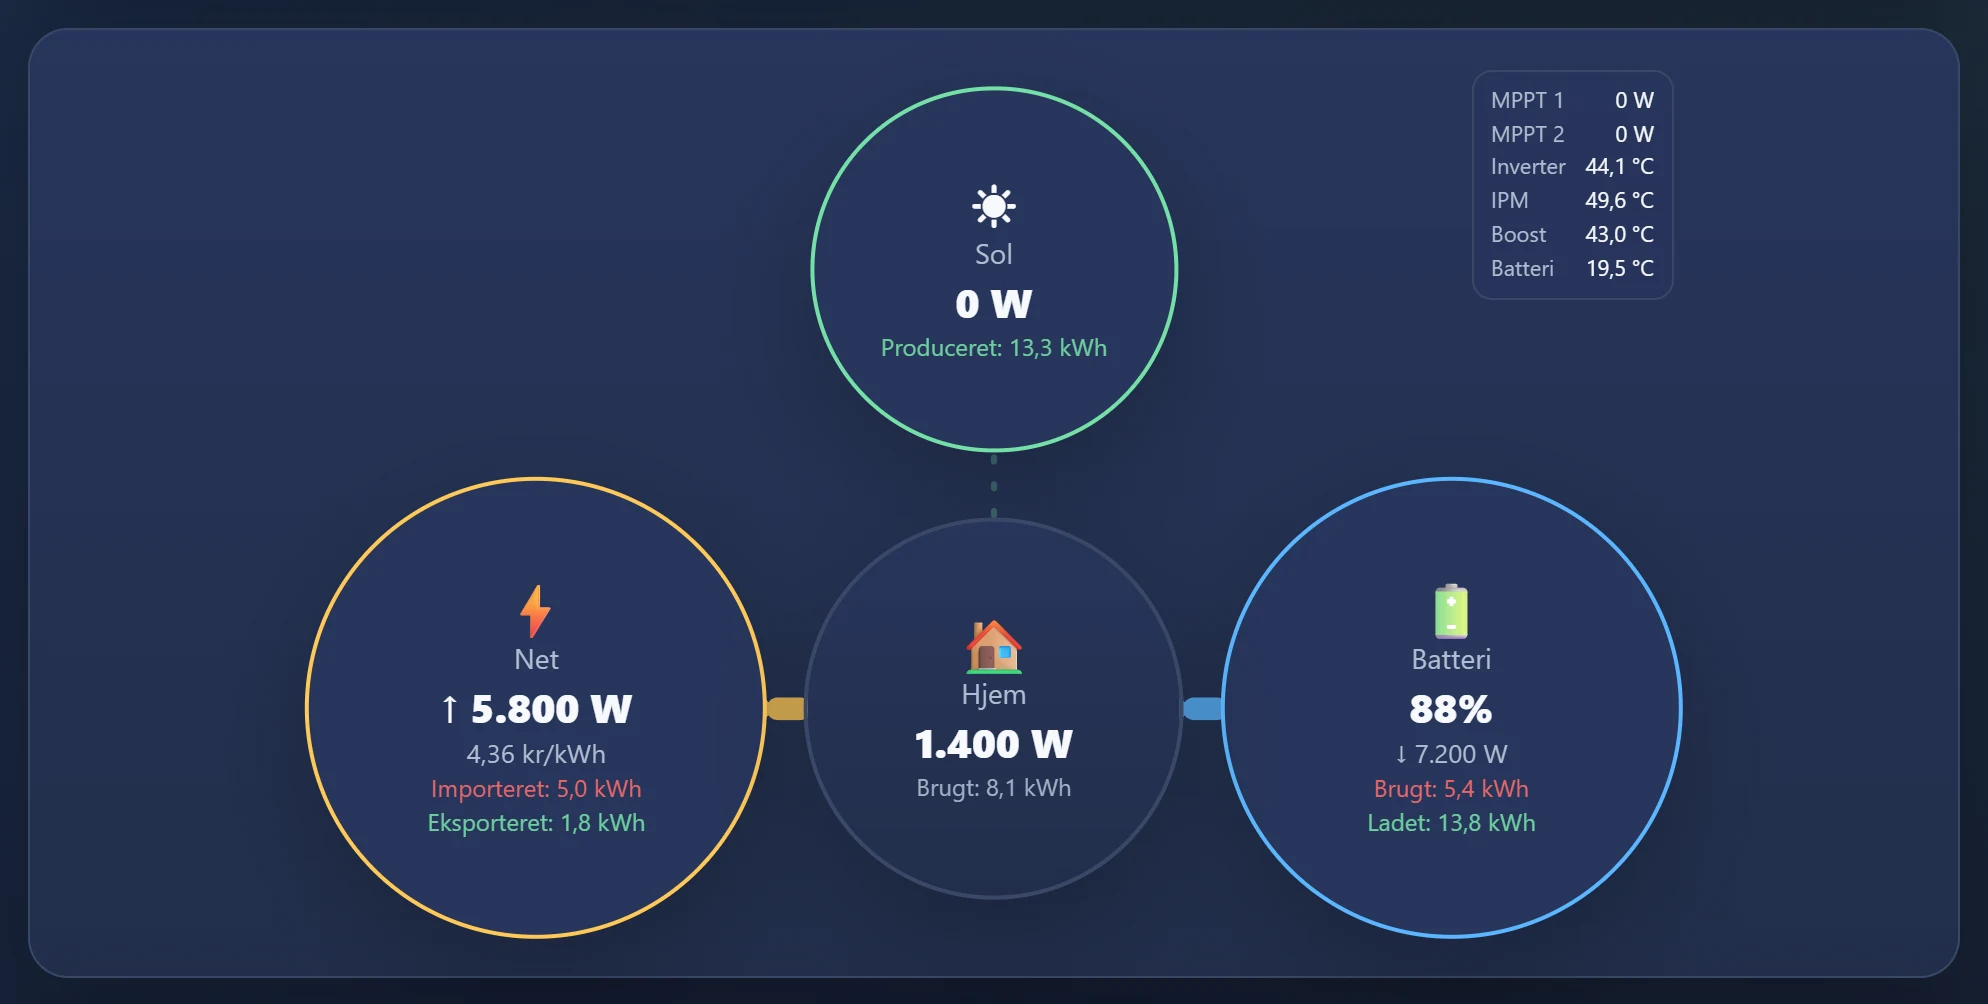
- Sun
- What the solar panels are producing now, and how much they have produced today.
- Home
- What the house is using now, and how much it has used today.
- Grid
- What you're buying or selling right now, the price right now, and how much you have bought and sold today. The arrow shows the direction.
- Battery
- The state of charge, whether the battery is charging or discharging, and how much has been charged and used today.
Above the flow is Today's overview with production, consumption, export, import and battery today. The small box shows the power on each solar string and the temperature in the inverter and battery. At the top right you see whether the dongle is connected. If it says GridZeno dongle not connected, the dongle hasn't reported in for 5 minutes; see Troubleshooting.
Further down are Today's electricity prices (Buy) and Today's electricity prices (Sell) hour by hour. With the arrows you switch between yesterday, today and tomorrow, and See every quarter hour opens Electricity prices.
Savings and strategy on Overview
What you have saved, and what GridZeno is working towards.
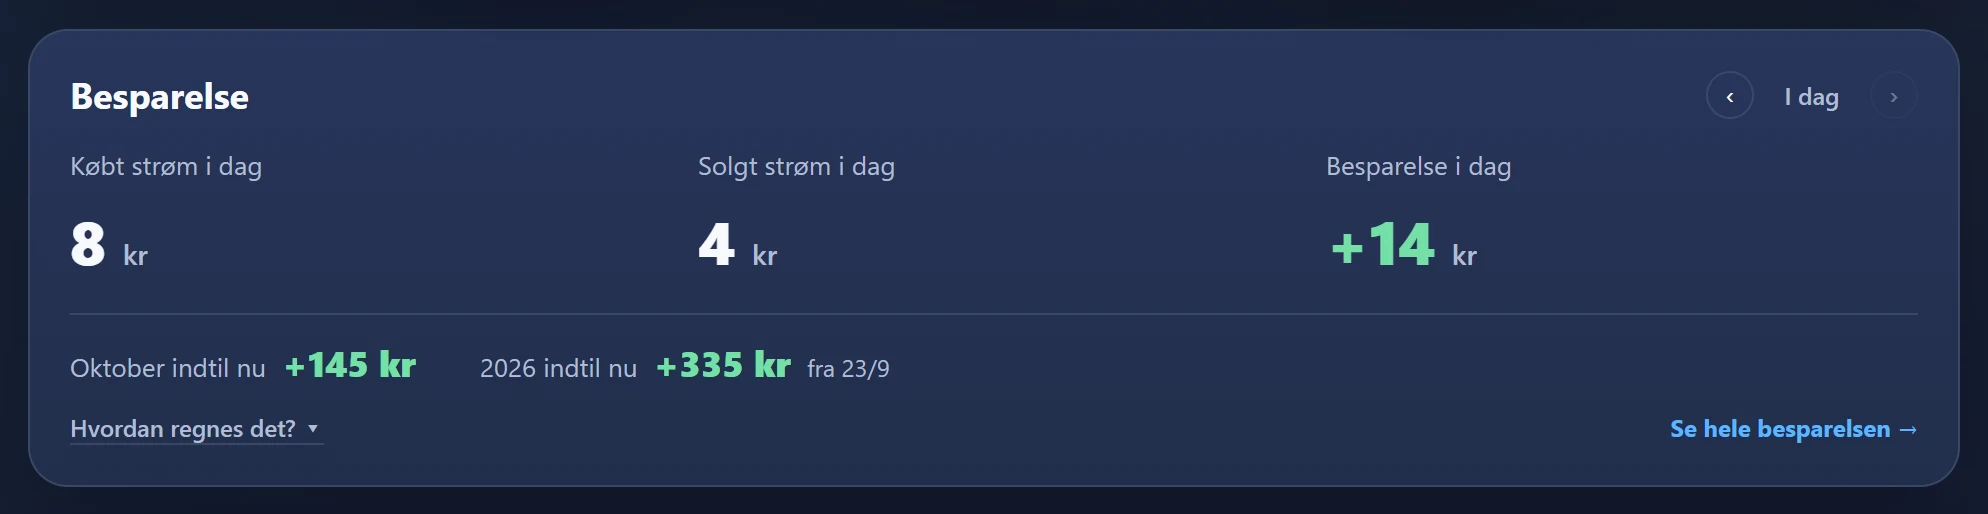
With the arrows you go back one day at a time, up to 31 days. How is it calculated? expands the explanation, and See all the savings opens the Savings page.
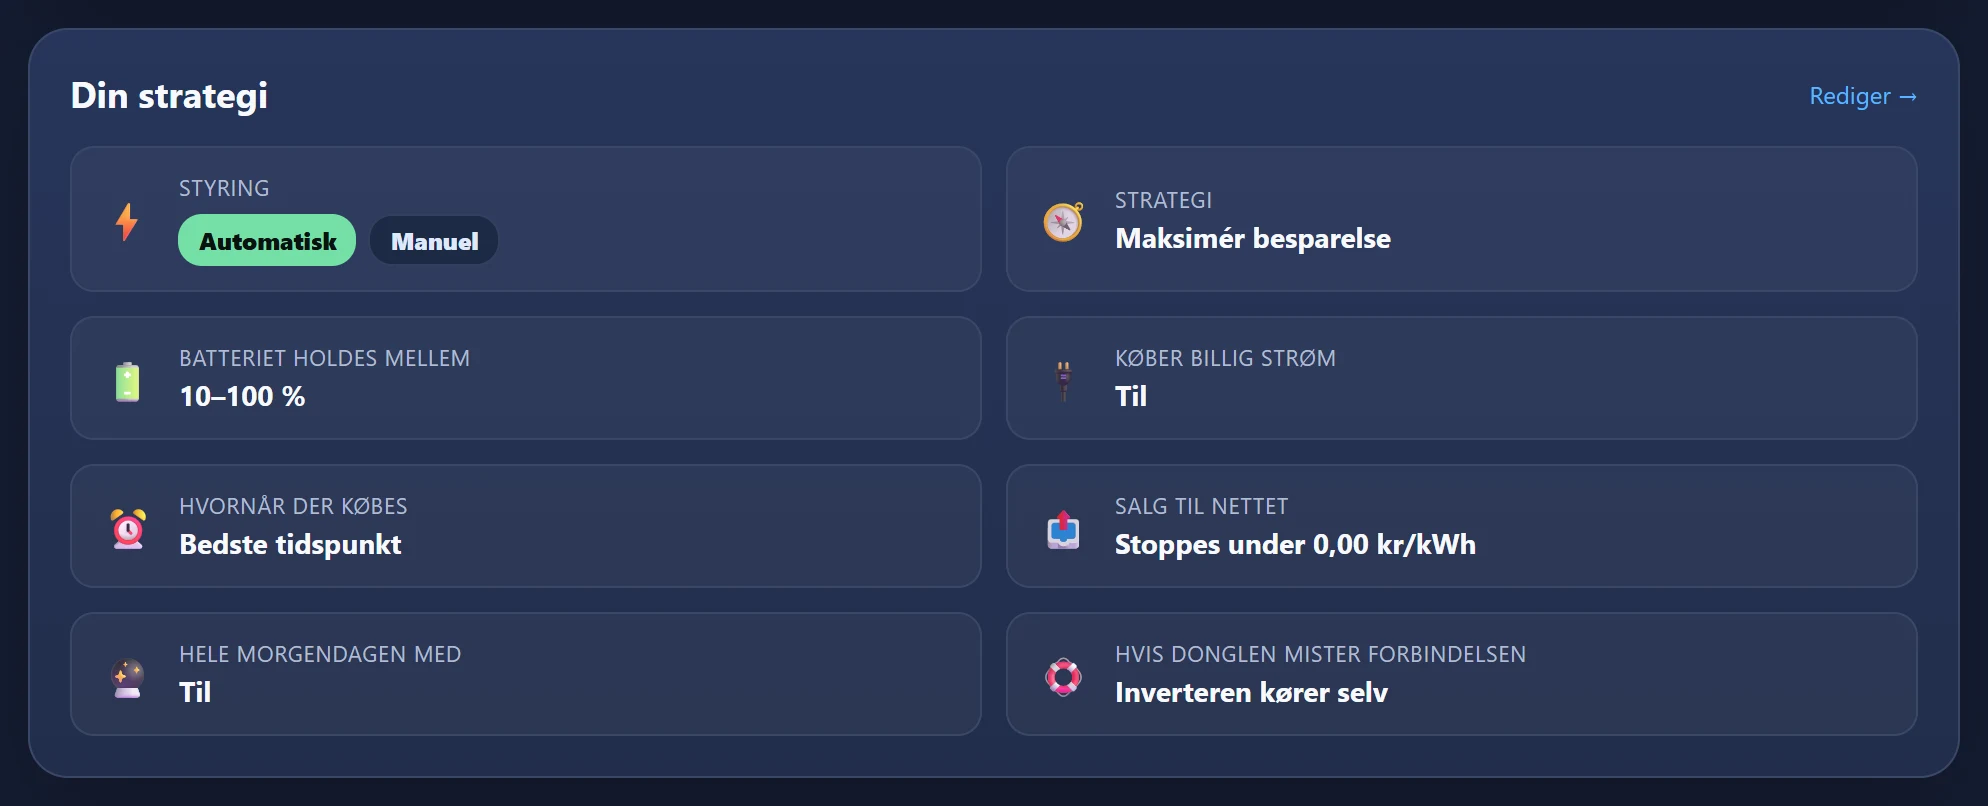
Here you can switch between Automatic and Manual directly from the front page. The choice is saved straight away. The rest is explained in Make your plan.
Plan
What GridZeno has done, is doing now and will do, with a reason for every step.
Overview shows the next three actions. The whole plan is under Plan in the menu.
- The day bar
- All of today and tomorrow as coloured blocks, one colour per action, with a line for now. Press a block to open the action.
- Earlier today
- What has already happened, with the measured figures. Collapsed; press Show.
- Happening now
- The action that's running right now. It's highlighted.
- Coming up
- What GridZeno intends to do, with the battery's path, e.g. Battery 90 % → 73 %, and the price.
- 1Press an action
Also one that has happened.
- 2Read Why?
Why GridZeno chose exactly that one: the price, the plan's own note and the battery afterwards. For an action that has happened, it shows what the plan said at the time, and whether it happened as planned.
- 3See Energy in the period
What the house uses, what the solar panels give, what is bought or sold, and what it costs or earns.
- 4See How the dongle does it
What the dongle asks the inverter for, e.g. Battery First to a target, or that the battery stands still.
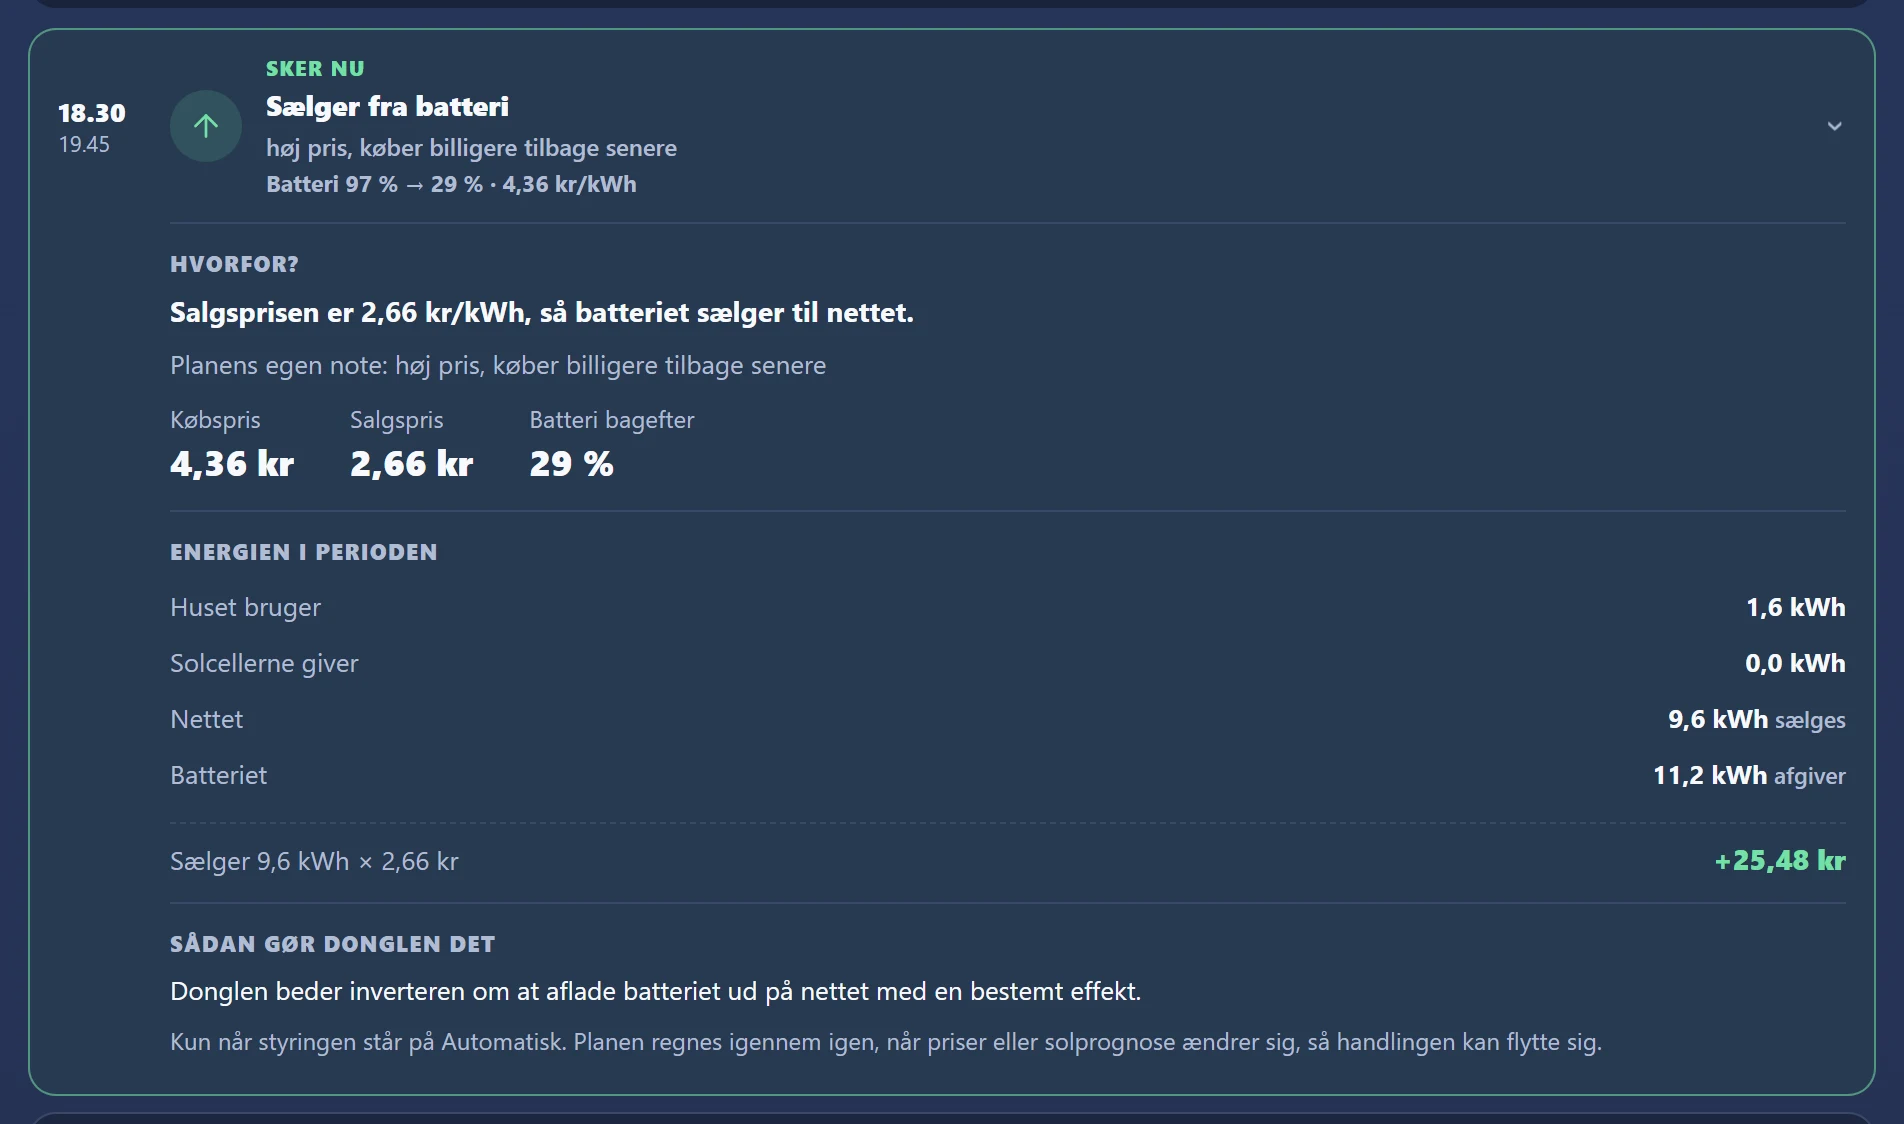
The plan is recalculated every hour with Pro, every 3 hours with Smart and every day with Light, and straight away when tomorrow's prices arrive, when you change a setting, and when the dongle finds a change in the system. It's only carried out when the control is set to Automatic.
At the bottom of the page, Try them in the Plan tester leads to the Plan tester, where you can see what other settings would have done. See Plan tester.
Energy
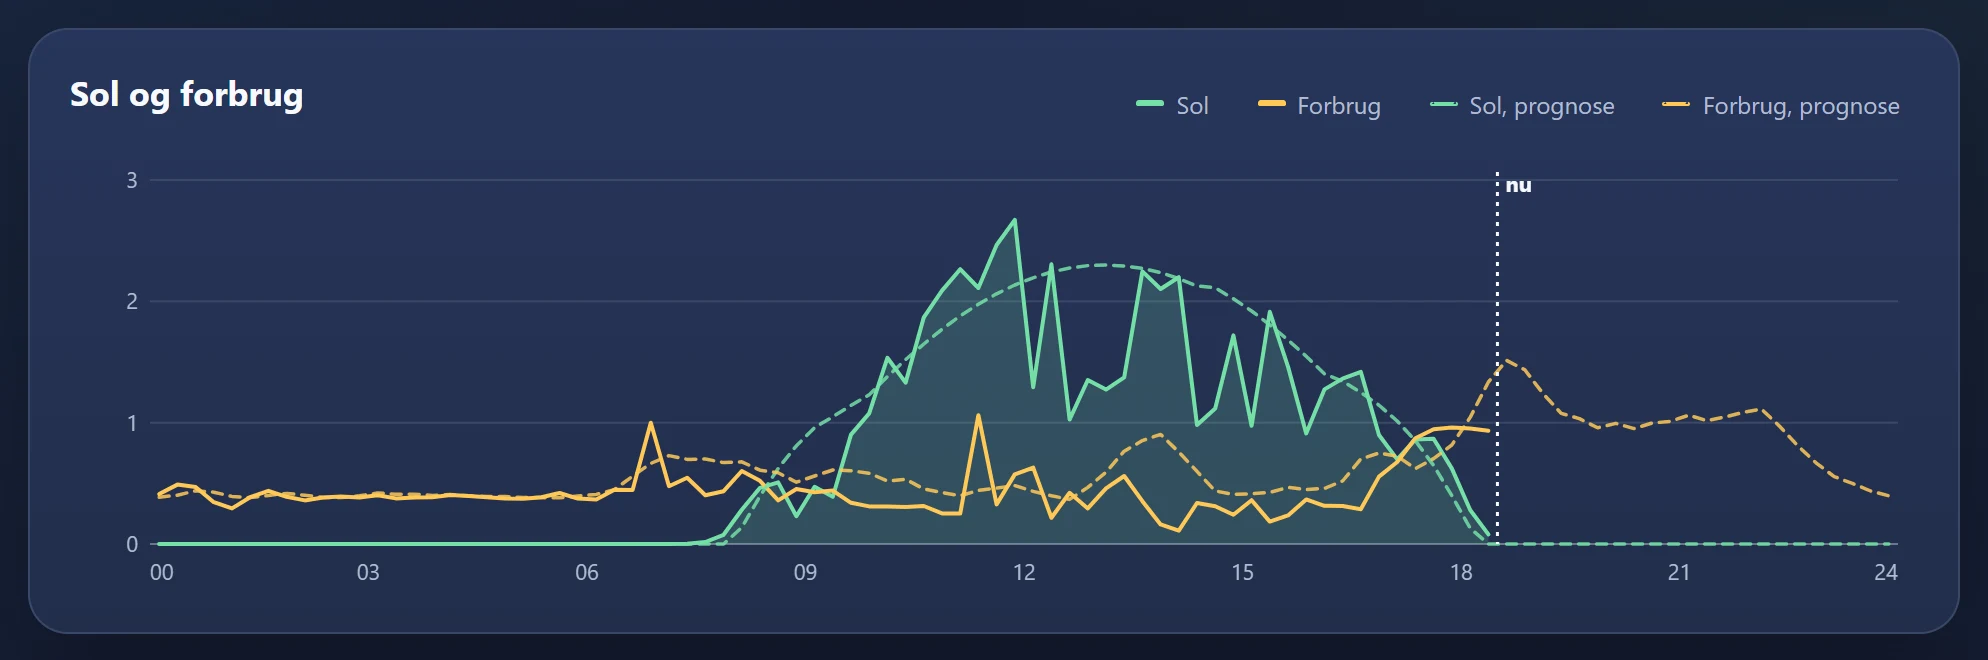
Your system quarter hour by quarter hour: what has happened, and what the forecast expects.
- 1Choose a day
With the arrows, with the buttons Yesterday, Today, Tomorrow and The day after tomorrow, or in the date field. You can go 31 days back and as far ahead as the forecast reaches.
- 2Read the key figures
Sun, Consumption, Bought, Sold and Battery for the day, in kroner. For a day that has passed, it also shows what the forecast said.
- 3Read the charts
Sun and consumption, The grid (bought above the line, sold below) and Battery in per cent. If you have connected an electric car, there's also a chart for it.
- 4Turn lines off and on
Press a name above a chart to hide it, and again to show it. The chart rescales.
- 5Point at a quarter hour
All the figures for that quarter hour are then shown.
Today is measured until now and forecast for the rest. Buying, selling and the battery follow the plan as far as the plan reaches, also when it charges from the grid, holds the battery or sells from it. Further ahead it says the plan reaches until ….
At the bottom, How well does the solar forecast hit shows the last 7 days, measured against the forecast. Press a day to open it.
A gap in the curve means that measurements are missing, e.g. because the connection has been down.
Electricity prices
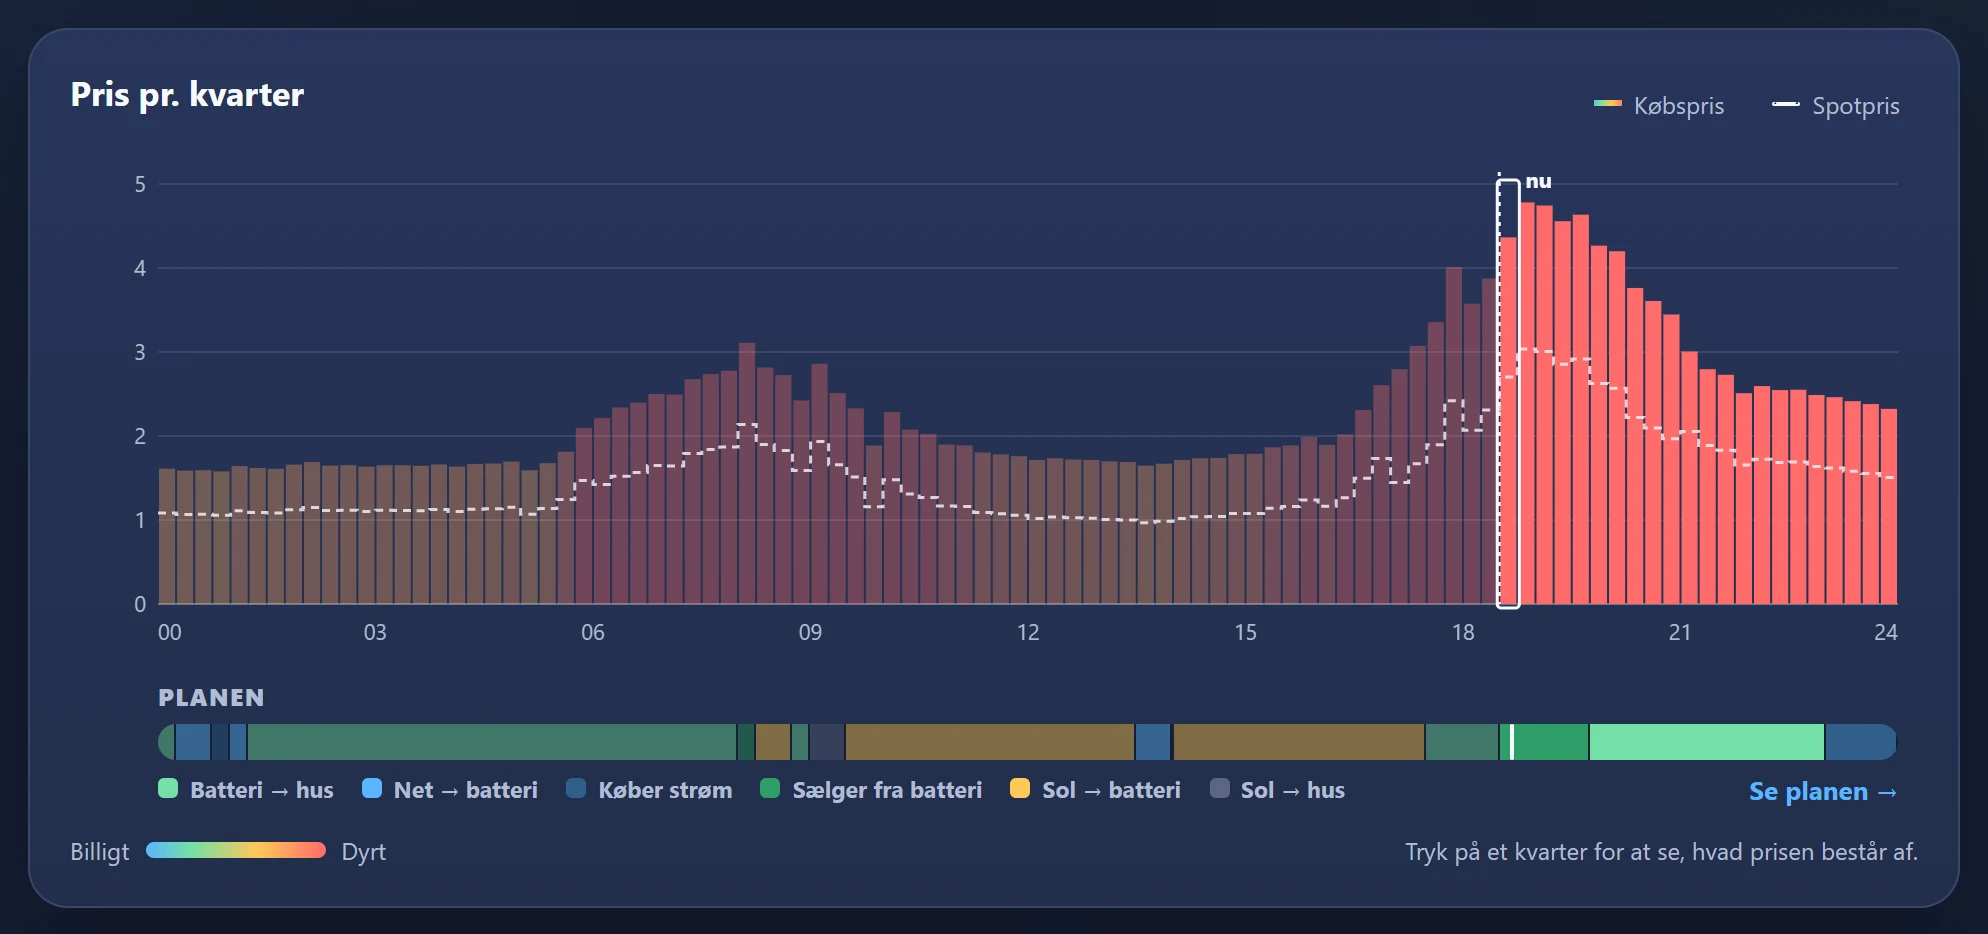
What power costs, and what you get for it, quarter hour by quarter hour.
- 1Choose Buy or Sales
Buy is what you pay for 1 kWh from the grid. Sell is what you get for 1 kWh you send out.
- 2Choose a day
Yesterday, today or tomorrow, or a day up to 31 days back. Tomorrow can be chosen when the prices are out, normally around 13:00.
- 3Read the key figures
The price now and the difference from the rest of the day, the average, and the cheapest and most expensive price. Press a figure to choose the quarter hour.
- 4Press a quarter hour
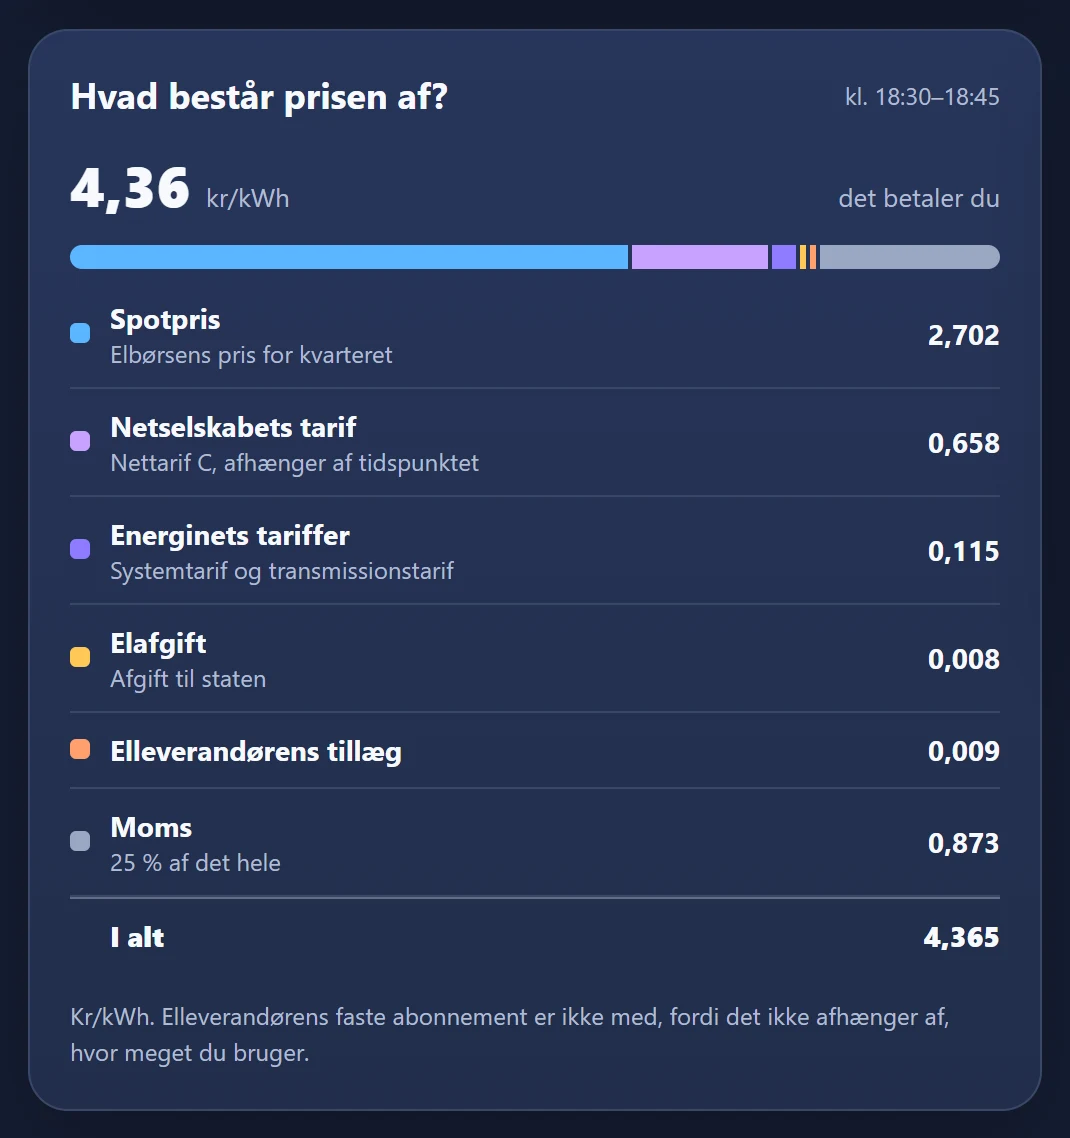
What makes up the price? then shows exactly that quarter hour. The arrow keys move one quarter hour at a time.
Under When is power cheapest? are the cheapest hour, the cheapest 3 hours in a row and the most expensive hour, good times for e.g. the dishwasher and the washing machine. On Sell it instead says When does it pay to sell?. If you have price messages, your limits are shown as dashed lines on the selling chart.
Under the chart is the plan's day bar, so you can see what GridZeno does with the price. See the plan opens Plan.
Savings
What the solar panels and the battery have saved you, and where it comes from.
- 1Choose Day, Week, Month or Year
With the arrows you go back or forward one period. To today takes you back.
- 2Read the heading
What you have saved, on average per day, and the period before. Next to it's what the power would have cost without solar panels and battery, what you paid net, and how large a share of the consumption you covered yourself.
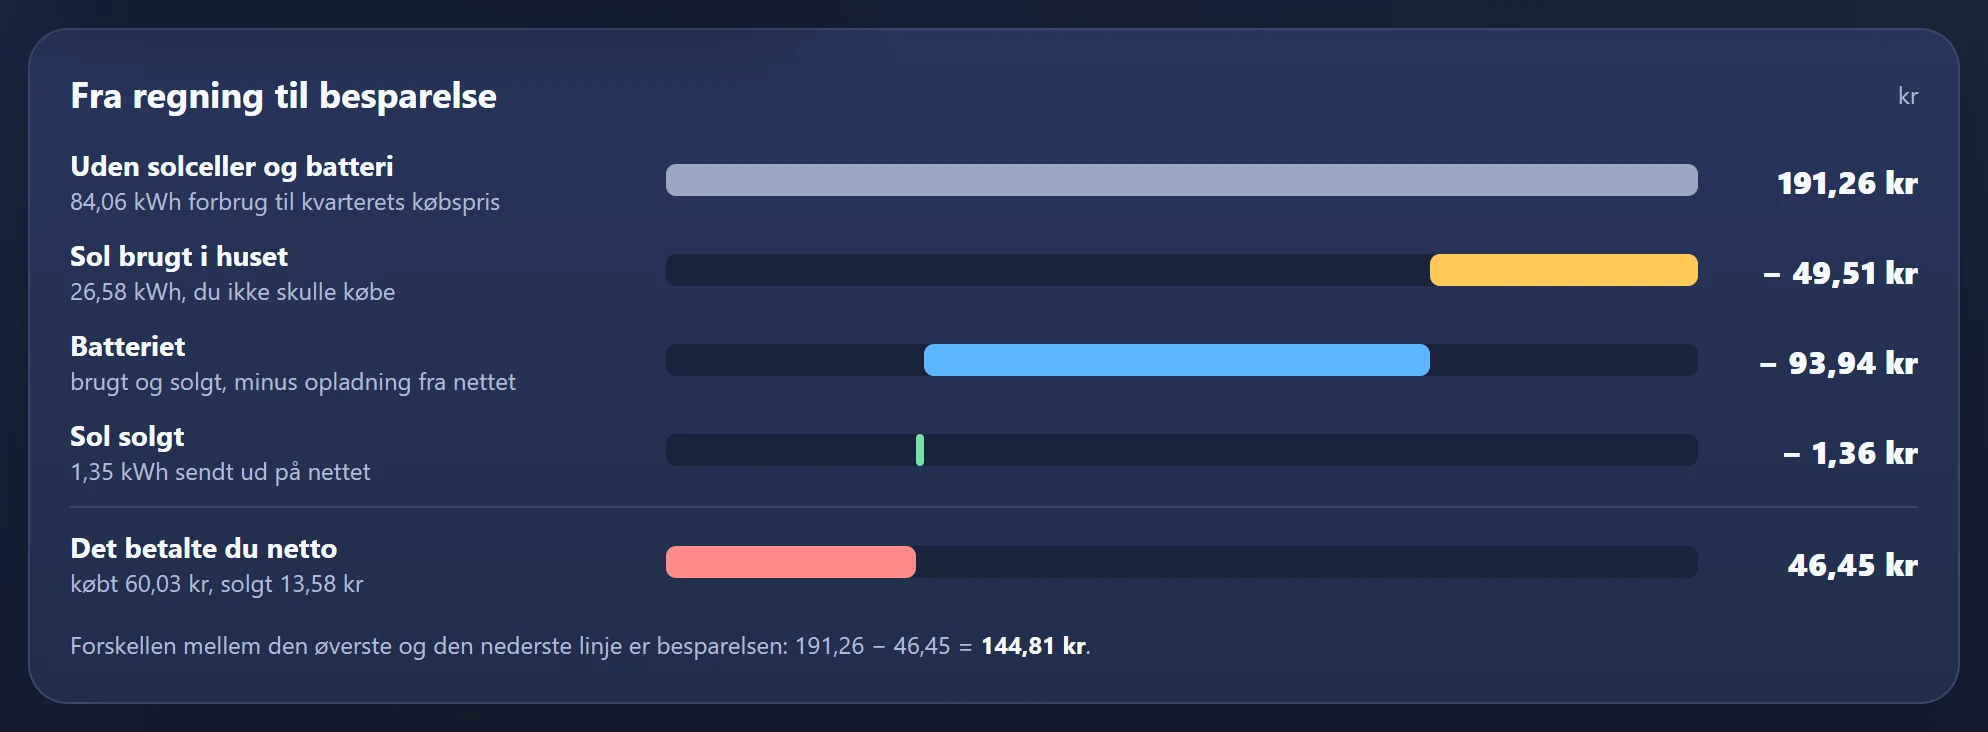
- 3Read From bill to savings
Line by line: solar used in the house, the battery and solar sold. The difference between the top and bottom lines is the savings.
- 4Read The solar panels and The battery
Where the sun went, and what the battery did: used in the house, sold, charged from the grid and with solar, cycles and estimated wear.
- 5See the chart
The savings per hour, day or month, split between solar panels and battery. It can go below zero.
- 6Expand How the figures are calculated
The whole calculation with the period's own figures.
The savings are what the consumption would have cost at each quarter hour's buying price without solar panels and battery, minus what you paid net. Read more about how the savings are calculated.
Ready for cheaper
power?
Check whether your inverter fits, and let the plan charge the battery and sell power in the right quarter hours.